Over the past decade, Woodinville’s housing market has experienced dramatic appreciation:
2015–2019: Strong growth fueled by historically low interest rates (3–4%), tech job expansion in nearby Redmond and Bellevue, and limited inventory. Median home prices rose steadily.
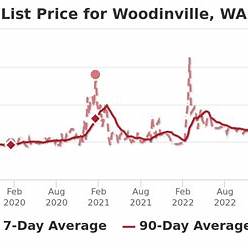
2020–2021: The pandemic created a surge in demand for suburban homes. Remote work increased interest in larger properties with outdoor space. Home values spiked by 20–25% year-over-year.
2022–2023: With interest rates climbing sharply (from ~3% to over 7%), buyer demand cooled. Prices plateaued and even dipped slightly in late 2022.
2024–2025: Modest recovery underway. Home prices have started to rise again, though at a slower pace, as rates stabilize and inventory remains tight.
📌 As of early 2025, Woodinville’s median home price sits around $1.41 million, a strong indicator of its sustained desirability even through economic headwinds.
📊 Economic Indicators and Forecasts
1. Interest Rates
Current: 30-year fixed rates hover around 6.7%.
Forecast: The Fed has signaled potential rate cuts in late 2025 or early 2026, which could further ease mortgage costs and reignite demand.
2. Employment & GDP
Seattle Metro Area: Unemployment remains low (~3.5%), thanks to tech, biotech, and logistics.
GDP Growth: Slower but stable; expected to grow at 1.5–2.2% annually.
3. Inflation
After peaking in 2022–2023, inflation has cooled to around 3.2%, and should continue trending downward, which supports real income stability.
🏘️ Real Estate-Specific Factors in Woodinville
1. Housing Shortage
Residential: Inventory remains tight. New construction is constrained due to zoning laws, high land values, and limited large parcels. Bidding wars still occur in premium pockets.
Commercial: Office and retail vacancies have increased slightly post-pandemic. However, adaptive reuse and live/work zoning initiatives are gaining traction.
2. Rental Market
Rental demand remains strong, especially for single-family homes.
Occupancy: 95%+
Rental Yield: Around 3.5–4%, with luxury homes earning slightly less but appreciating faster.
3. Supply & Demand Balance
Months of inventory: ~1.8 (indicates a seller’s market).
Buyer demand: Highest among move-up buyers, luxury seekers, and out-of-state relocators.
🔁 Comparative Analysis: Now vs. 2007–2009
Factor 2007–2009 Crisis 2024–2025 Environment
Home Equity Low, many underwater High—owners sitting on strong equity
Interest Rates Falling (post-crash) High but flattening
Lending Standards Lax (subprime loans) Strict underwriting
Inventory Oversupply in 2008 Undersupply continues
Foreclosures Surge Very low
🟢 Conclusion: Today’s market is much more structurally sound than 2007–2009, with limited foreclosure risk and much healthier equity positions.
🔮 Predictive Insights: Next 2 Years (2025–2027)
🏡 Residential Outlook
Prices: Likely to increase 3–6% annually if rates decline modestly.
Buyer Pool: May expand with Gen Z entering the market and remote/hybrid workers moving out of Seattle.
New Builds: Still constrained, adding pressure to existing home values.
🏢 Commercial Outlook
Retail centers with high walkability and mixed-use design will perform better.
Older office spaces may continue to face pressure unless adapted for residential or co-working use.
💡 Risks
A potential recession or spike in unemployment could freeze buyer activity.
Prolonged high rates (if inflation rebounds) would delay recovery and erode affordability.
💰 Opportunities
Buyers: Window for negotiation still exists before broader recovery takes off.
Investors: Solid rental demand and long-term appreciation make SFR (single-family rentals) a strong bet.